These blog posts will build up into a complete description of a 2D marine processing sequence. They are based on our tutorial datasets, which in turn came from the New Zealand Government’s Ministry of Economic Development under the “Open File” System.
The processing sequence we have developed so far is:
-
apply a combined minimum phase conversion and
anti-alias filter
-
re-sample from 2 ms sample interval to 4 ms sample
interval
-
assign a simple straight line 2D marine geometry
-
check the geometry by plotting offsets over the
shots and near traces
-
true amplitude recovery using a T2
spherical divergence correction
-
trace edits using peak-amplitude analysis to
identify noisy shots and channels
In this post I’m going to continue cleaning up the shot records,
to get them ready for more signal processing, by addressing some of the noise
issues we identified earlier.
Here’s a shot record with a swell noise burst, plotted
alongside its FK
response.
The swell noise shows up as low frequency (in this case less
than 5 Hz) energy with a broad spatial frequency band (indicated in red). This
overlaps with the tail-buoy jerk (white) which is also low frequency, but dips
from the tail of the cable to the head. These often occur together, with liquid-filled
seismic streamers; modern streamers achieve their neutral buoyancy through foam
not oil. The motion of the tail-buoy over the sea swell sets up waves that
propagate through the cable, creating the noise.
The direct and refracted arrivals are highly spatially aliased (purple)
and wrap back over the reflected signals we want to preserve; the aliased data
crosses the K=0 axis at about 62.5 Hz, which is at the high end of our frequency
band. We can also see some periodicity in the FK plot indicating short period
multiples, as well as the back dipping (tail-to-head) reflections caused by
structure we extend below the K=0 line.
The combination of the XT and FK displays suggest approaches
we can use to tackle these noise issues, the main one of which is swell noise.
We can:
- throw data away by editing the traces that have swell noise present
- address the swell noise and tail-buoy jerk by removing only those frequencies
- address the swell noise and tail-buoy jerk by muting them in the FK-domain; retaining the low frequency signal (along with some noise) around the K=0 axis
There is also another technique we can use called “projective
filtering”; this takes a moving time- and space- window and looks at the
frequency content, aiming to locate and scale back anomalous low frequency
noise within a trace automatically.
Firstly I’ll define a window below the direct and refracted
arrivals for the technique to be applied in. This will avoid introducing
artefacts into the data, which can happen at sharp amplitude boundaries. Most
software allows you to design a spatial application gate in this way, above (or
below) which the process isn’t applied.
Secondly, when I go into the FK domain I’ll use a removable
AGC which will also help to avoid any amplitude complications.
 |
| FK Domain mute designed to remove swell noise and tail-buoy jerk, while preserving low frequency reflections. Data above the red line will be muted in the FK domain |
Both of these approaches will help to remove artefacts.
For the FK approach, the mute I have picked is designed to
be above the direct and refracted arrivals, including the aliased components;
we’ll worry about those later.
These are the four basic processes we can test; we could of
course vary the low-cut filters, or modify how the FK mute was applied –
however the projective filtering is very effective in this case.
It is also important to look at what is being removed from
the data by calculating “difference” plots to make sure that we are not
removing signal.
If we compare the band-pass filter approach to the
projective filtering, we can see that this removes less signal:
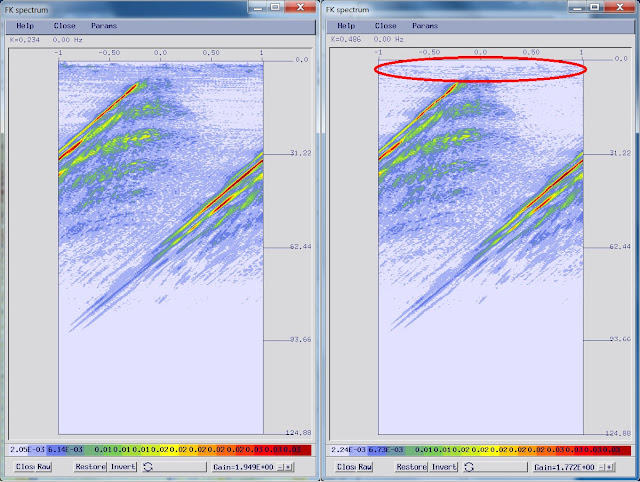
Finally, here are the FK plots from the input data and the
same shot with projective filtering applied (as an additional check):
 |
| The FK spectra of the input shot record (left) and after projective filtering (right); the signature of the swell noise and tail-buoy jerk (red) have been attenuated |
If you were testing this, in practice you would use more
than one shot; a selection of shots from along the line, ideally ones that you
have identified as having swell noise issues as part of the noise QC tests you
have run so far.
In this case I’ll continue processing using the projective
filtering. If you didn’t have this
available then varying the filter (or the frequency “cut” for the FK mute) can
increase how harshly the swell noise is attenuated, but of course can cost you
signal.
One of the techniques you can employ is to select just the
traces with significant swell noise for the harshest filtering. In our software you can store the peak
amplitude in a trace header and then select traces where this exceeds a given
value.
Now
we have de-spiked and “clean” shot records. The next thing we need to address
is the strong linear noise from the direct and refracted arrivals.


No comments:
Post a Comment